Most efficient solar panels 2024

Solar Panel Efficiency explained
Solar panel efficiency is the amount of sunlight (irradiance) that falls on the surface of a solar panel and is converted into electricity. Due to the many advances in photovoltaic technology over recent years, the average panel conversion efficiency has increased from 15% to over 23%. This significant jump in efficiency resulted in the power rating of a standard-size panel increasing from 250W to over 440W.
As explained below, solar panel efficiency is determined by two main factors: the photovoltaic (PV) cell efficiency, based on the solar cell design and silicon type, and the total panel efficiency, based on the cell layout, configuration, and panel size. Increasing the panel size can improve efficiency by creating a larger surface area to capture sunlight, with the most powerful solar panels now achieving well over 700W power ratings.
Highest efficiency panels from the leading manufacturers
The last two years have seen a surge in manufacturers releasing more efficient solar panels based on high-performance N-type HJT, TOPcon and Back-contact (IBC) cells. For those unfamiliar with the technical terminology, these are all monocrystalline (N-type) solar cell variations and have become dominant across the solar industry over the last two years. Traditional Polycrystalline cells are no longer manufactured. Learn more about N-type cells.
The solar cell type, design and configuration all have an impact on panel efficiency with the N-Type back-contact (IBC) cells being the most efficient.
SunPower Maxeon panels are back in the top spot with the new Maxeon 7 series, currently in limited release. Sunpower led the industry for over a decade until lesser-known manufacturer Aiko Solar launched the Black Hole series panels with an impressive 23.8% module conversion efficiency using a unique new ABC (All Back Contact) cell technology in 2023. Recom Tech also announced a next-generation Black Tiger series with 23.6% efficiency using a new TOPcon Back-contact cell architecture. LONGi Solar was previously the second manufacturer, behind Sunpower, to reach a module efficiency level of 23% with the new Hi-Mo 6 Scientists series, based on a hybrid IBC cell design, which LONGi calls HPBC. Canadian Solar and, more recently, REC and Huasun Solar revealed next-generation panels built using HJT cells, which are on par with the efficiency level of the renowned Maxeon series.
Other leading manufacturers include Jinko Solar, Trina Solar, Huasun, Phono, and JA Solar, which feature next-generation TOPCon and HJT cells. High-performance panels from SPIC and Belinus using IBC cells have also closed the gap, plus new panels featuring N-type TOPCon cells from TW Solar, Astronergy, DAS Solar, Risen, Qcells and most established manufacturers have helped boost panel efficiency above 22%.
Top 10 Most Efficient Residential Solar Panels 2024 *
| # | Make | Model | Power | Efficiency |
|---|---|---|---|---|
| 1 | SunPower | Maxeon 7 | 445 W | 24.1 % |
| 2 | Aiko Solar | Black Hole series | 470 W | 23.8 % |
| 3 | Recom Tech | Black Tiger | 460 W | 23.6 % |
| 4 | AEG | BC Premium | 460 W | 23.6 % |
| 5 | Longi Solar | Hi-Mo 6 Scientist | 450W | 23.3 % |
| 6 | Huasun Solar | Himalaya G1 | 450 W | 23.0 % |
| 7 | Canadian Solar | TOPHiKu6 | 470 W | 23.0 % |
| 8 | TW Solar | Repower N | 455 W | 22.8 % |
| 9 | Astronergy | AstroN5s | 445 W | 22.8 % |
| 10 | Trina Solar | Vertex N | 505 W | 22.7 % |
* Last update Feb 2024. Residential size panels - 54 to 66 cells (108-HC, 120-HC or 132-HC) and 96/104 cell formats. Does not include commercial panels greater than 2.0m in length.
Cell Efficiency
Cell efficiency is determined by the cell structure and type of substrate used, which is generally either P-type or N-type silicon, with N-type cells being the most efficient. Cell efficiency is calculated by what is known as the fill factor (FF), which is the maximum conversion efficiency of a PV cell at the optimum operating voltage and current. Note cell efficiency should not be confused with panel efficiency. The panel efficiency is always lower due to the internal cell gaps and frame structure being included in the calculated area. See further details below.
The cell design plays a significant role in panel efficiency. Key features include the type of base silicon substrate, busbar configuration, and passivation type. Panels built using back-contact (IBC) cells are currently the most efficient (up to 24.1%) due to the high purity N-type silicon substrate and no losses from busbar shading. However, panels developed using the latest N-Type TOPcon and advanced heterojunction (HJT) cells have achieved efficiencies above 23%. Next-generation Tandem Perovskite cells are still under development and are expected to become commercially viable within the next two years, with cell efficiency levels over 27%, resulting in panels reaching 25% efficiency.
For a deeper technical insight, Progress in Photovoltaics publishes listings of the latest photovoltaic cell technologies twice a year.
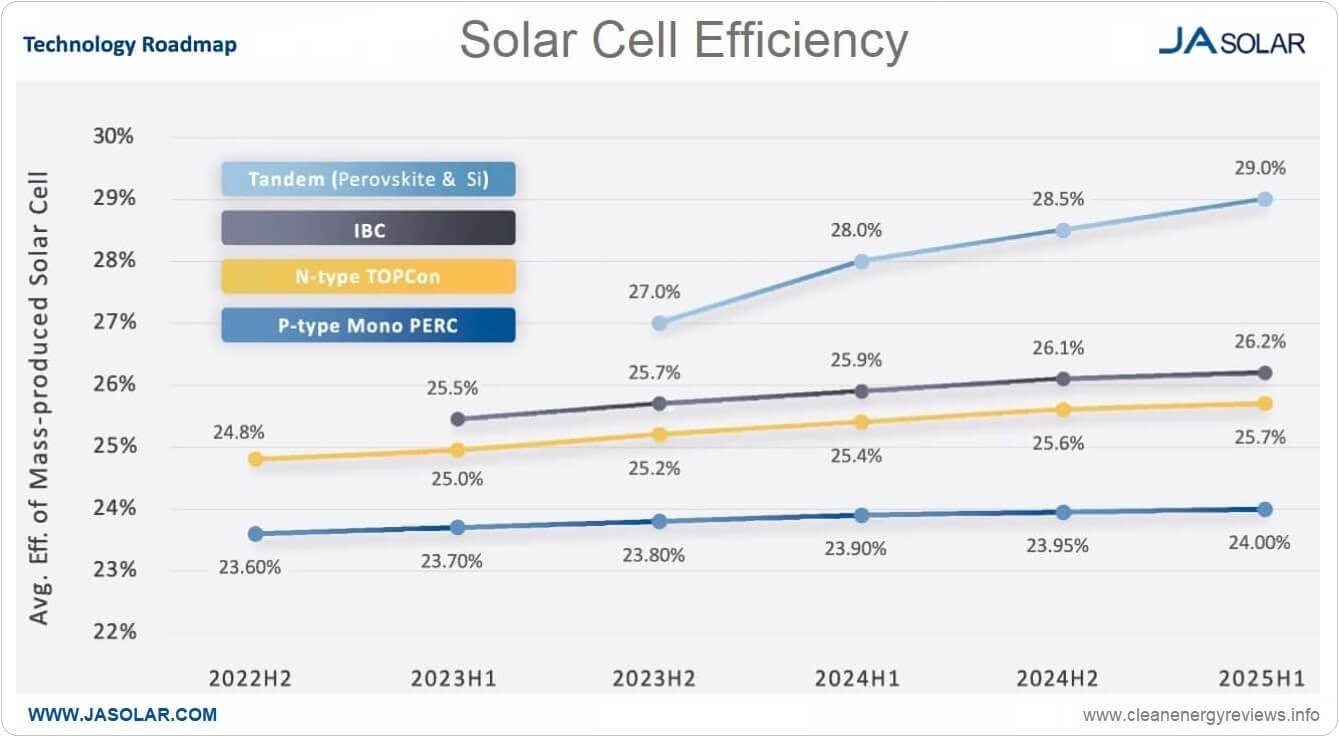
Solar cell efficiency chart of projected cell efficiency increase from 2022 to 2025 - Image credit JA Solar
Panel Efficiency
Solar panel efficiency is measured under standard test conditions (STC) based on a cell temperature of 25°C, solar irradiance of 1000W/m2 and Air Mass of 1.5. A solar panel's efficiency (%) is calculated by dividing the module power rating (W), or Pmax, by the total panel area in square meters at an irradiance level of 1000W/m2 (STC). This is essentially the power output divided by the power input, expressed as a percentage.
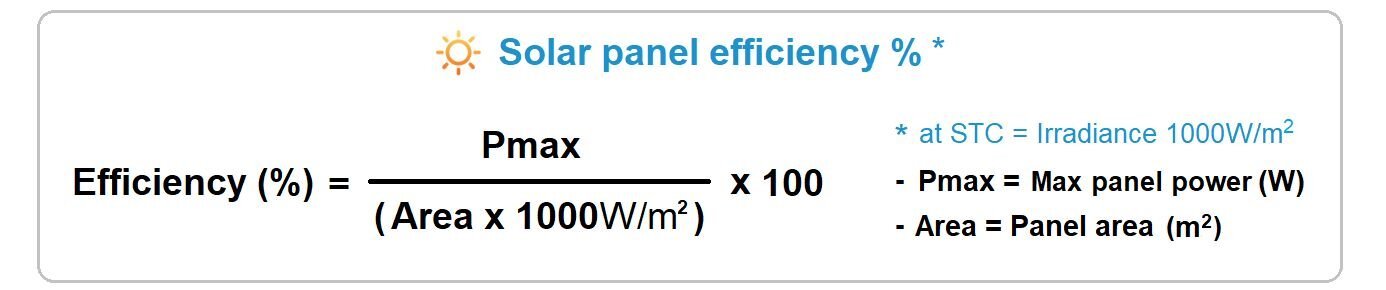
Solar panel efficiency is calculated by dividing the module power rating (Pmax) by the area (m2) at STC (1000W/m2)
Many factors, including temperature, irradiance level, cell type, and interconnection of the cells can influence overall panel efficiency. Surprisingly, even the colour of the protective backsheet can affect efficiency. A black backsheet might look more aesthetically pleasing, but it absorbs more heat resulting in higher cell temperature, which increases resistance; this, in turn, slightly reduces total conversion efficiency.
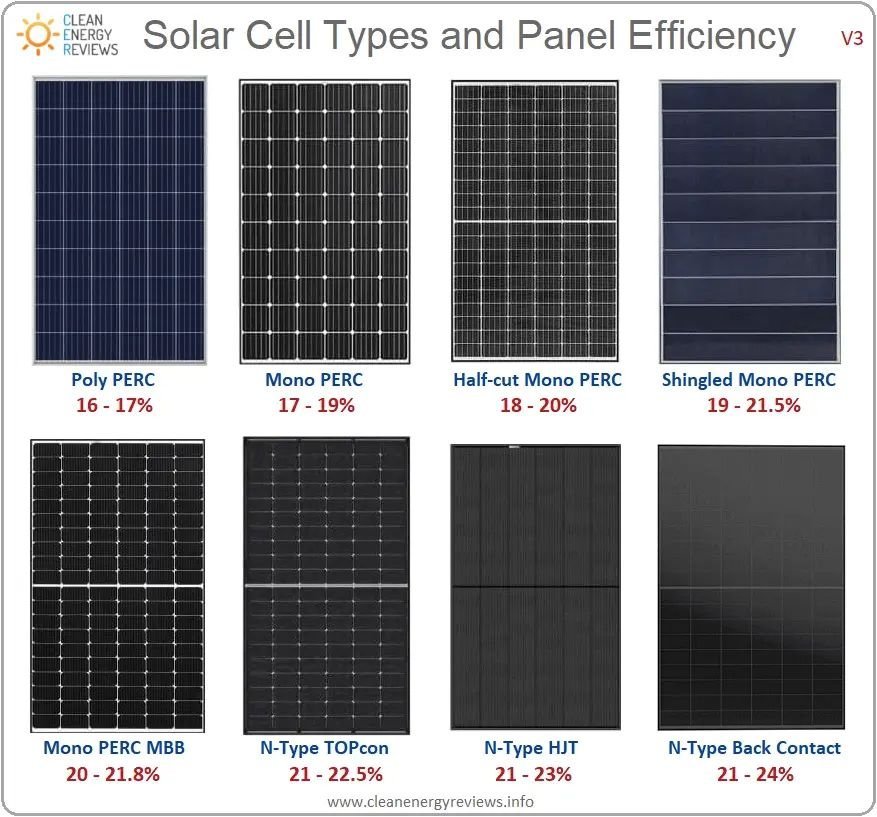
Panels built using ‘Interdigitated back contact’ or IBC cells are the most efficient, followed by heterojunction (HJT) cells, TOPcon cells, half-cut and multi-busbar monocrystalline PERC cells, shingled cells and finally 60-cell (4-5 busbar) mono cells. 60-cell poly or multicrystalline panels are generally the least efficient and equally the lowest cost panels.
Comparison chart of the most efficient solar panels
Below is the latest Clean Energy Reviews downloadable chart of the top 20 most efficient residential solar panels for 2024. PV cell technology details included for comparison.

Why efficiency matters
The term efficiency is thrown around a lot, but a slightly more efficient panel doesn’t always equate to a better quality panel. Many people consider efficiency the most important criterion when selecting a solar panel, but what matters most is the manufacturing quality, which is related to real-world performance, reliability, manufacturer’s service, and warranty conditions. Read more about selecting the best quality solar panels here.
Faster Payback
In environmental terms, increased efficiency generally means a solar panel will pay back the embodied energy (energy used to extract the raw materials and manufacture the solar panel) in less time. Based on detailed lifecycle analysis, most silicon-based solar panels repay the embodied energy within two years, depending on the location. However, as panel efficiency has increased beyond 20%, payback time has reduced to less than 1.5 years in many locations. Increased efficiency also means a solar system will generate more electricity over a solar panel's average 20+ year life and repay the upfront cost sooner, meaning the return on investment (ROI) will be improved.
Longer life and lower degradation
Solar panel efficiency generally indicates performance, primarily as most high-efficiency panels use higher-grade N-type silicon cells with an improved temperature coefficient and lower power degradation over time. More efficient panels using N-type cells benefit from a lower rate of light-induced degradation or LID, which is as low as 0.25% of power loss per year. When calculated over the panel's 25- to 30-year life, many high-efficiency panels are still guaranteed to generate 90% or more of the original rated capacity, depending on the manufacturer’s warranty details. Due to the higher purity composition, N-type cells offer higher performance by having a greater tolerance to impurities and lower defects, increasing overall efficiency.
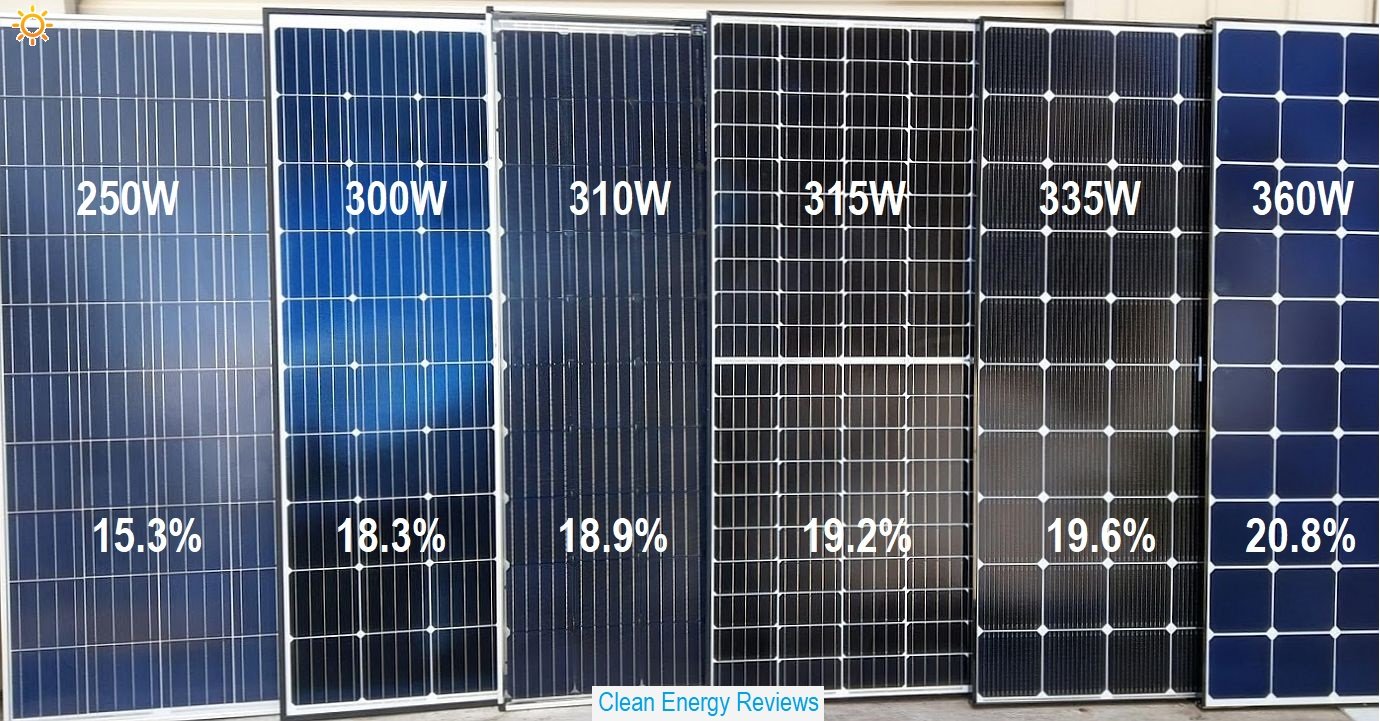
Solar panels with different efficiency - Trina 250W poly panel, 300W and 310W mono panels, 315W half-cut 120 cell, 335W multi-busbar and on the far right the high 20.8% efficiency 360W LG Neon R panel.
Area Vs Efficiency
Efficiency does make a big difference in the amount of roof area required. Higher efficiency panels generate more energy per square meter and thus require less overall area. This is perfect for rooftops with limited space and allows larger capacity systems to be fitted to any roof. For example, 12 x higher efficiency 440W solar panels, with a 22.5% conversion efficiency, will provide around 1200W (1.2kW) more total solar capacity than the same number of similar size 300W panels with a lower 17.5% efficiency.
12 x 300W panels at 17.5% efficiency = 3,600 W
12 x 440W panels at 22.5% efficiency = 5,280 W
Real-world efficiency
In real-world use, solar panel operating efficiency depends on many external factors. Depending on the local environmental conditions, these various factors can reduce panel efficiency and overall system performance. The main factors which affect solar panel efficiency are listed below:
Solar Irradiance (W/m2)
Shading
Panel orientation
Temperature
Location (latitude)
Time of year
Dust and dirt
The factors which have the most significant impact on panel efficiency in real-world use are irradiance, shading, orientation and temperature.
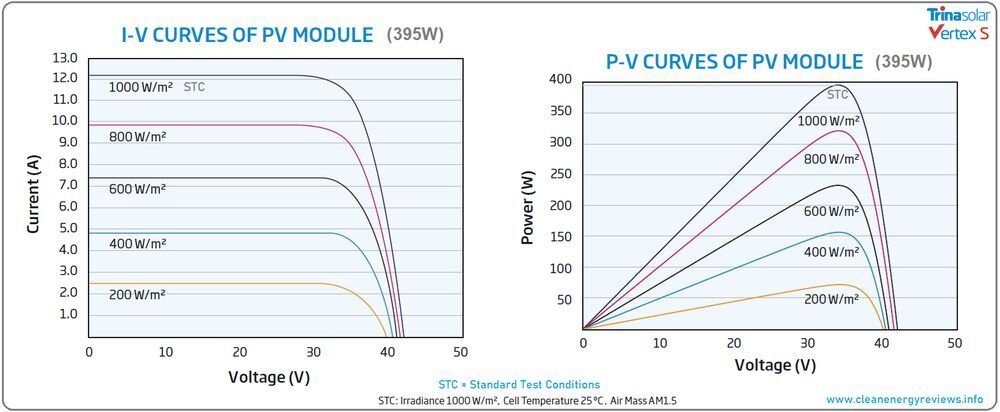
The power curves above highlight the relationship between irradiance and panel power output.
Solar Irradiance
The level of solar irradiance, also called solar radiation, is measured in watts per square meter (W/m2) and is influenced by atmospheric conditions such as clouds & smog, latitude and time of year. The average solar irradiance just outside the Earth's atmosphere is around 1360 W/m2, while the solar irradiance at ground level, averaged throughout the year, is roughly 1000W/m2, hence why this is the official figure used under standard test conditions (STC) to determine the solar panel efficiency and power ratings. However, solar irradiance can be as high as 1200W/m2 in some locations during the middle of summer when the sun is directly overhead. In contrast, solar irradiance can fall well below 500W/m2 on a sunny day in winter or in smoggy conditions.
Shading
Naturally, if the panels are fully shaded, the power output will be very low. However, partial shading can also have a big impact, not only on panel efficiency but on reliability and total system efficiency. For example, partial shading on a single panel in a string can reduce power output by 50% or more, reducing the power of the entire string by a significant amount; panels are connected in series and shading one panel affects the whole string. More importantly, permanent or fixed shading over a small area can cause the bypass diodes to fail, leading to more severe problems. Therefore, it is very important to try to reduce or eliminate shading if possible. Luckily, there are add-on devices known as optimisers and microinverters, which can reduce the negative effect of shading, especially when only a small number of panels are shaded. Using shorter strings in parallel can also help reduce the impact of shading, as the shaded panels in one string will not reduce the current output of parallel unshaded strings.
Efficiency Vs temperature
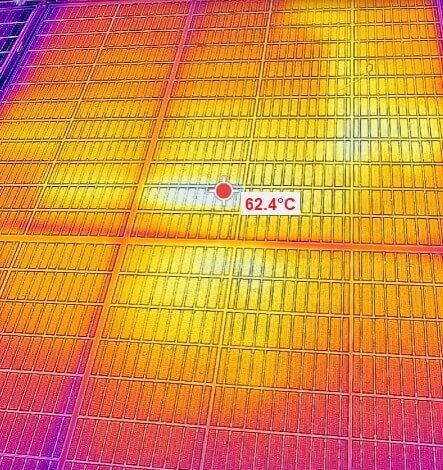
The power rating of a solar panel, measured in Watts (W), is calculated under Standard Test Conditions (STC) at a cell temperature of 25°C and an irradiance level of 1000W/m2. However, in real-world use, cell temperature generally rises well above 25°C, depending on the ambient air temperature, wind speed, time of day and amount of solar irradiance (W/m2). During sunny weather, the internal cell temperature is typically 20-30°C higher than the ambient air temperature, which equates to approximately 8-15% reduction in total power output - depending on the type of solar cell and its temperature coefficient. Most manufacturers also specify the power rating under NOCT conditions, or the Nominal Operating Cell Temperature, to provide an average real-world estimate of solar panel performance. NOCT performance is typically specified at a cell temperature of 45°C and a lower solar irradiance level of 800W/m2, which attempts to approximate a solar panel's average real-world operating conditions.
Conversely, extremely cold temperatures can increase power generation above the nameplate rating as the PV cell voltage increases at lower temperatures below STC (25°C). Solar panels can exceed the panel power rating (Pmax) for short periods of time during very cold weather. This often occurs when full sunlight breaks through after a period of cloudy weather.
The Power Temperature Coefficient
Cell temperatures above or below STC will either reduce or increase the power output by a specific amount for every degree above or below 25°C. This is known as the power temperature coefficient which is measured in %/°C. Monocrystalline panels have an average temperature coefficient of -0.38% /°C, while polycrystalline panels are slightly higher at -0.40% /°C. Monocrystalline N-type IBC cells have a much better (lower) temperature coefficient of around -0.30%/°C, while the best-performing cells at high temperatures are HJT (heterojunction) cells which are as low as -0.25% /°C.
Temperature coefficient of different PV cell technologies
The power temperature coefficient is measured in % per °C - Lower is more efficient.
Polycrystalline P-Type cells - 0.39 to 0.43 % /°C
Monocrystalline P-Type cells - 0.35 to 0.40 % /°C
Monocrystalline N-type TOPcon - 0.29 to 0.32 % /°C
Monocrystalline N-Type IBC cells - 0.29 to 0.31 % /°C
Monocrystalline N-Type HJT cells - 0.25 to 0.27 % /°C
The chart below highlights the difference in power loss between panels using different PV cell types. N-type heterojunction (HJT), TOPcon and IBC cells show far lower power loss at elevated temperatures compared to traditional poly and monocrystalline P-Type cells.
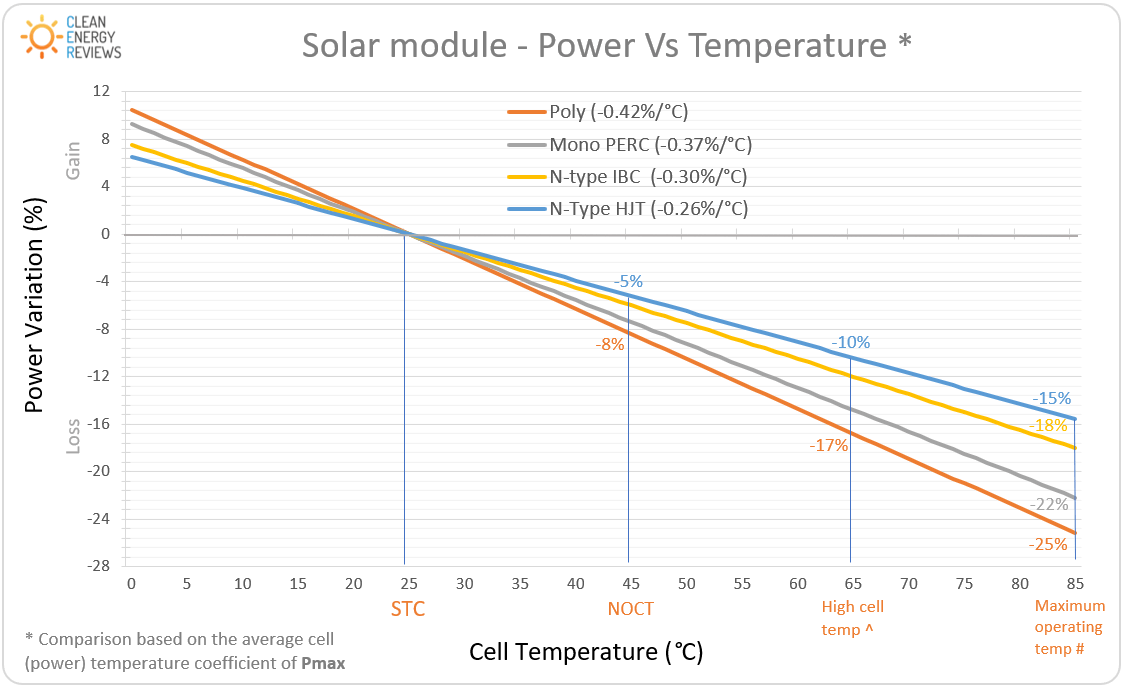
Solar panel Power Vs Temperature comparison chart for various cell types - Note the cell (panel) temperature is typically 20 to 30°C above the ambient air temperature.
Power Vs Temperature chart notes:
STC = Standard test conditions - 25°C (77°F)
NOCT = Nominal operating cell temperature - 45°C (113°F)
(^) High cell temp = Typical cell temperature during hot summer weather - 65°C (149°F)
(#) Maximum operating temp = Maximum panel operating temperature during extremely high temperatures mounted on a dark coloured rooftop - 85°C (185°F)
Cell temperature is generally 20°C higher than the ambient air temperature which equates to a 5-8% reduction in power output at NOCT. However, cell temperature can rise as high as 85°C when mounted on a dark coloured rooftop during very hot 45°C, windless days which is generally considered the maximum operating temperature of a solar panel.
Most efficient solar Cells
The most efficient solar panels on the market generally use either N-type (IBC) monocrystalline silicon cells or other highly efficient N-type variations, including heterojunction (HJT) and TOPcon cells. Most manufacturers traditionally used the standard and lower-cost P-type mono-PERC cells; however, many large-volume manufacturers, including JinkoSolar, JA Solar, Longi Solar, Canadian Solar and Trina Solar, are now rapidly shifting to more efficient N-type cells using HJT or TOPcon cell designs.
Efficiency of panels using different cell types
Polycrystalline - 15 to 18%
Monocrystalline - 16.5 to 19%
Polycrystalline PERC - 17 to 19.5%
Monocrystalline PERC - 17.5 to 20%
Monocrystalline N-type - 19 to 20.5%
Monocrystalline N-type TOPcon - 21 to 22.6%
Monocrystalline N-type HJT - 21.2 to 23.0%
Monocrystalline N-type IBC - 21.8 to 23.8% **
** Several new variations of Interdigitated Back Contact (IBC) cell architectures have emerged, of which the exact cell construction has not been fully disclosed. This includes LONGi Solar’s Hybrid Passivated Back Contact (HPBC) technology and Aiko Solar’s ABC (All Back Contact) cell technology.
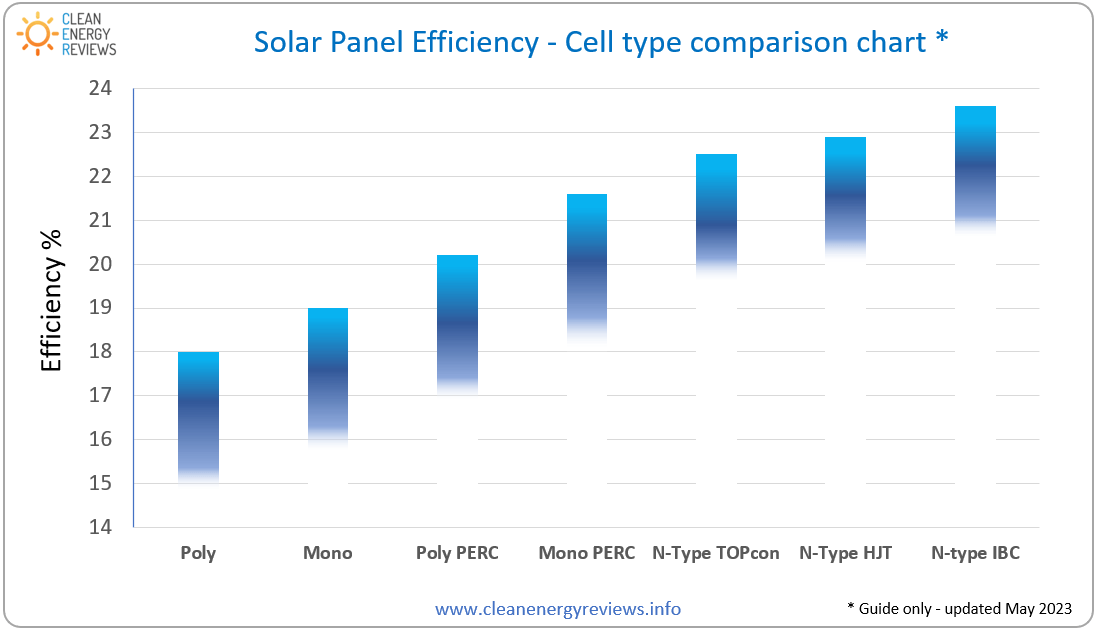
* Approximate average solar PV cell efficiency comparison chart - Mono and poly silicon types
Cost Vs Efficiency
All manufacturers produce a range of panels with different efficiency ratings depending on the silicon type used and whether they incorporate PERC, multi busbar or other cell technologies. Very efficient panels above 21% featuring N-type cells are generally much more expensive, so if cost is a major limitation, it would be better suited to locations with limited mounting space. Otherwise, you can pay a premium for the same power capacity which could be achieved by using 1 or 2 additional panels. However, high-efficiency panels using N-type cells will almost always outperform and outlast panels using P-type cells due to the lower rate of light-induced degradation or LID, so the extra cost is usually worth it in the long term.
For Example, a high-efficiency 400W+ panel could cost $350 or more, while a common 370W panel will typically cost closer to $185. This equates to roughly $0.50 per watt compared to $0.90 per watt. Although in the case of the leading manufacturers such as Sunpower, Panasonic and REC, the more expensive panels deliver higher performance with lower degradation rates and generally come with a longer manufacturer or product warranty period, so it’s often a wise investment.
Panel Size Vs Efficiency
Panel efficiency is calculated by the power rating divided by the total panel area, so just having a larger size panel does not always equate to higher efficiency. However, larger panels using larger size cells increases the cell surface area which does boost overall efficiency.

In the past, most common residential panels used the standard 6” (156mm) square 60-cell panels, while commercial systems use the larger format 72-cell panels. However, as explained below, a new industry trend emerged in 2020 towards much larger panel sizes built around larger size cells, which increased panel efficiency and boosted power output up to an impressive 600W.
Common Solar panel sizes
60 cell panel (120 HC) : Approx width 0.98m x length 1.65m
72 cell panel (144 HC) : Approx width 1.0m x length 2.0m
96/104 cell panel: Approx width 1.05m x length 1.75m
66 cell panel (132 HC) - Approx width 1.10m x length 1.85m
78 cell panel (156 HC): Approx width 1.30m x length 2.4m
HC = half-cut cells

A standard size 60-cell (1m x 1.65m) panel with 18-20% efficiency typically has a power rating of 300-330 Watts, whereas a panel using higher efficiency cells, of the same size, can produce up to 370W. As previously explained, the most efficient standard-size panels use high-performance N-type IBC or Interdigitated Back Contact cells which can achieve up to 22.8% panel efficiency and generate an impressive 390 to 440 Watts.
Popular half-cut or split cell modules have double the number of cells with roughly the same panel size. A panel with 60 cells in a half-cell format is doubled to 120 cells, and 72 cells in a half-cell format have 144 cells. The half-cut cell configuration is slightly more efficient as the panel voltage is the same, but the current is split between the two halves. Due to the lower current, half-cut panels have lower resistive losses, resulting in increased efficiency and a lower temperature co-efficient, which also helps boost operating efficiency.
New Larger cells and high power 600W+ panels
To decrease manufacturing costs, gain efficiency and increase power, solar panel manufacturers have moved away from the standard 156mm (6”) square cell wafer size in favour of larger wafer sizes. There are a variety of various cell sizes now available with the most popular being 166mm, 182mm and 210mm. The larger cells combined with new larger panel formats have enabled manufacturers to develop extremely powerful solar panels with ratings up to 700W. Larger cell sizes have a greater surface area and when combined with the latest cell technologies such as multi-busbar (MBB), TOPcon and tiling ribbon, can boost panel efficiency well above 22%.
Solar questions
Visit our community discussion about the best solar panels in our solar forum